


0ms is the resolution floor, not a score
LeetCode's 0ms badge comes from a millisecond stopwatch timing code that finishes in microseconds — it rounds every fast-enough answer down to the same zero. Getting the O(n) algorithm right is the one decision that actually matters, made once, in Python. What happens after that is a separate question with a separate instrument: cycles per character, read off the hardware with perf, not a clock.
- Why LeetCode's 0ms badge can't tell two O(n) solutions apart
- The four kinds of runtime number, ranked least to most trustworthy
- Cycles per character: 335.88 in Python, down to 2.71 in tuned C
- What -march=native costs the fleet you don't control
Submit a correct, O(n) sliding-window solution to LeetCode’s “Longest Substring Without Repeating Characters,” and the runtime panel says 0 ms. Submit a version that does something visibly wasteful inside the same O(n) shape — say, rebuilding a small lookup structure every iteration instead of reusing one — and it can say 0 ms too. Two solutions, meaningfully different amounts of work, same badge.
That is not a bug in LeetCode. It is what a millisecond-resolution wall clock does when the thing it is timing finishes in microseconds: it rounds both answers down to the smallest number it can report, and the smallest number it can report is zero. The badge did not measure your code and conclude it was fast. It measured your code and ran out of resolution before it could tell you anything.
So the honest question was never “how do I get 0ms.” It was always: once the algorithm is right, what actually happens on the hardware, and how do you measure something small enough to be real? This piece answers that in two stages — Python first, to get the algorithm right and pinned by tests; then C, measured with perf stat instead of a stopwatch — using one LeetCode problem, one machine, and numbers produced by running the code, not asserted.
The four things a runtime number can be
Every answer to “how fast is this” is one of four things, worth lining up from least to most trustworthy before trusting any of them.
A platform’s badge. LeetCode’s 0 ms — a single run, on a shared host, with GC/JIT warmup, network jitter, and container noise baked in, rounded to a resolution too coarse to see the thing you changed.
A cold, single-shot local run. Running your own solution once, locally, and reading elapsed time off it. This looks more trustworthy because you controlled it. It usually isn’t, for a reason the next section makes concrete: on a short-lived program, process startup can be the entire measurement.
A loop-amortized run. Run the same code many times in one process and divide by how much work was done. This is what the C solution’s own main() already does, and the technique this piece leans on throughout.
A hardware-counter-derived number. Not elapsed time at all — actual CPU events (cycles, instructions, cache misses) counted by the chip itself and divided by units of real work. This is what perf stat gives you, and it is the only one of the four immune to “the timer couldn’t see it.”
The rest of this piece only ever trusts the fourth kind, and shows what the first three get wrong along the way.
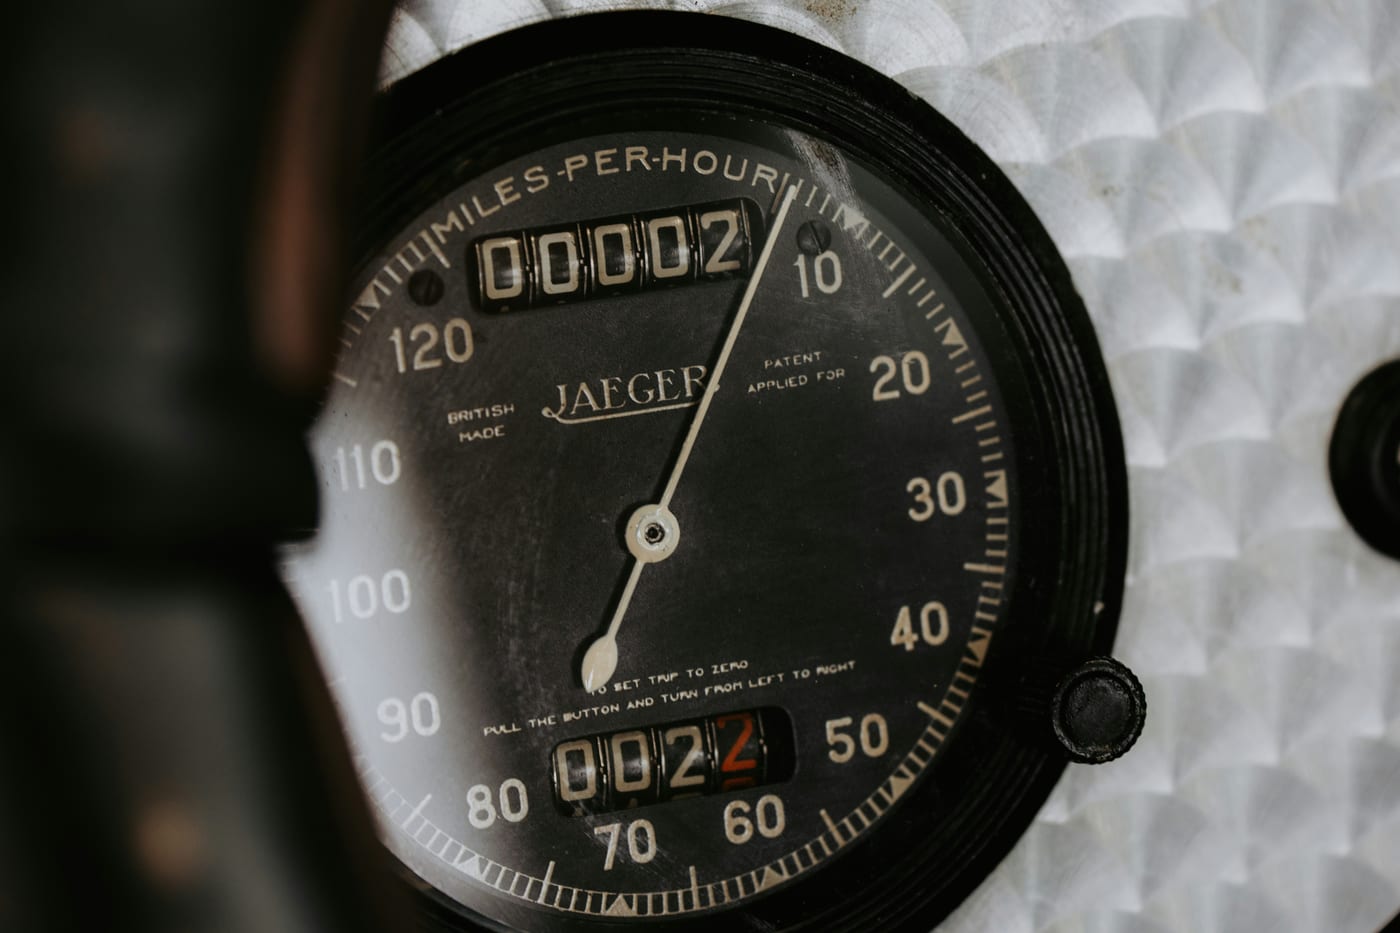
The needle reads near-zero. That tells you the gauge’s floor, not the car’s speed. Photo by Luke Miller on Unsplash.
The object: two pointers and a promise
Before any of that, the algorithm has to actually be right, and getting it right has nothing to do with C, compilers, or hardware. Longest Substring Without Repeating Characters is a single-pass sliding window: two pointers, left and right, both walking forward across the string, right always at or ahead of left, never backward.
class Solution:
    def lengthOfLongestSubstring(self, s: str) -> int:
        last_seen = {}
        left = 0
        best = 0

        for right, char in enumerate(s):
            if char in last_seen:
                left = max(left, last_seen[char] + 1)

            last_seen[char] = right
            best = max(best, right - left + 1)

        return best
right scans forward one character at a time. last_seen remembers the most recent index of every character seen so far. The moment right lands on a character already inside the current window, left jumps to just past that character’s last occurrence — never backward, because max refuses to let left retreat even if the repeat was outside the current window. Every character gets looked at once by right and, in the worst case, once by the left jump — O(n), not the O(n²) you get from re-scanning the window from every starting point.
That claim is worth pinning down, not trusting: test/01_longest_substring_unique_chars_test.py runs this against the standard cases — "abcabcbb" → 3, "bbbbb" → 1, "pwwkew" → 3, "" → 0 — before any performance question is allowed to matter. Get the shape right and prove it with tests first. Everything past this point is what happens to a solution that was already correct before anyone measured it.

Two pointers, one direction pad. Nothing about correctness needed a compiler yet. Photo by Patrick on Unsplash.
The number: cycles per character
Once correctness is settled, the metric this piece answers to is cycles per character — total CPU cycles the process spent, divided by total characters the algorithm actually processed. Not wall-clock milliseconds; not “operations per second” off a stopwatch. Two divisions explain why.
Divide by characters, not by calls. A single call over a 39-character string does less work than a call over a 39,000-character string. A number that ignores that difference isn’t comparable across inputs. Both the Python and C solutions here print a line matching N=<count> — the total characters actually run through the algorithm across however many times it ran — specifically so a wrapper script can compute this ratio instead of reporting raw seconds.
Divide by cycles, not by wall time. Wall time bundles in process startup, scheduling gaps, and whatever else was happening on the machine at that moment — none of which is the algorithm. perf stat -e cycles,instructions,branches,branch-misses,cache-references,cache-misses reads the CPU’s own hardware performance counters instead: how many clock cycles actually elapsed, how many instructions actually retired, how often a branch was mispredicted, how often a memory access missed cache. From cycles and instructions alone you get IPC — instructions retired per cycle, a shorthand for how much of each cycle the CPU spent doing useful work rather than stalled waiting on memory.
This is the actual instrument used for everything that follows: perf_stat.sh, a small wrapper that runs a binary under perf stat, greps its stdout for that N= line, and prints five numbers — cycles/character, instructions/character, IPC, branch-miss %, cache-miss % — instead of the raw counter dump.
The work: same algorithm, two languages, three measurements
First mistake, made honestly. Run the Python solution’s own __main__ — a single call over a 39-character benchmark string — under perf stat:
$ make perf FILE=01_longest_substring_unique_chars.py
result=26
N=39

── perf summary ──
cycles / character:       2031847.67
instructions / character: 2842010.10
Two million cycles per character. Read naively next to a C number later in this piece, that comparison would “prove” C is hundreds of thousands of times faster than Python, which is nonsense — and the reason it’s nonsense is the same reason LeetCode’s badge is nonsense. N=39 is tiny, and the Python interpreter’s own startup cost — importing the runtime, JIT-warming nothing because CPython doesn’t JIT, initializing the process — is almost the entire number, divided by 39. This measured interpreter startup, not the algorithm, for the identical reason a stopwatch on a single LeetCode run mostly measures scheduling noise on a shared host.
The fix is the same one make perf already applies to the C file: loop the algorithm enough times that startup stops dominating.
iterations = 1_000_000
result = 0
for _ in range(iterations):
    result += sol.lengthOfLongestSubstring(s)
print(f"N={len(s) * iterations}")
Pinned to one CPU core to remove a second source of noise this piece gets to in a moment, five runs of that loop land at a median of 335.88 cycles/character — six thousand times better than the naive number, and the only one of the two that means anything, because it is startup amortized across 78 million characters instead of concentrated into 39.
Port to C, change nothing about the algorithm. Same two pointers, same one-pass logic. What changes is the lookup: Python’s last_seen is a hash map; C’s is a 128-entry array indexed directly by byte value, because the input is ASCII and a byte is an index — no hash function, no bucket, no pointer chase.
int lengthOfLongestSubstring(const char *s) {
  int last[128] = {0};
  int left = 0, best = 0, i = 0;
  unsigned char *p = (unsigned char *)s;

  while (*p) {
    unsigned c = *p++;
    int next = i + 1;
    int prev = last[c];
    left = prev > left ? prev : left;
    int len = next - left;
    best = len > best ? len : best;
    last[c] = next;
    i = next;
  }
  return best;
}
Compiled with no optimization at all — -O0, the same flags the test build uses, specifically so a debugger points at the right line — and run the same way, pinned to one core:
$ gcc -std=c11 -O0 -g -fno-omit-frame-pointer 01_longest_substring_unique_chars.c -o build/01_O0
$ taskset -c 0 perf_stat.sh build/01_O0
cycles / character:       9.68
instructions / character: 35.05
IPC:                      3.622
9.68 cycles per character, against an unoptimized compile. That’s roughly 35× the loop-amortized Python number — and it came entirely from swapping a hash map for direct array indexing, and from what a compiled language’s baseline already skips (no interpreter loop dispatching on each bytecode, no reference counting on every touch of a value). No compiler cleverness has been asked for yet.
Now ask for it. Same source file, the flags this repo’s Makefile reserves for perf/run builds — -O2 -march=native -flto -fno-omit-frame-pointer:
$ gcc -std=c11 -O2 -march=native -flto -fno-omit-frame-pointer -g \
      01_longest_substring_unique_chars.c -o build/01_perf
$ taskset -c 0 perf_stat.sh build/01_perf
cycles / character:       2.71
instructions / character: 13.55
IPC:                      4.995
2.71 cycles per character. Another 3.6× on top of the unoptimized C build, from compiler flags alone — -O2 folding and inlining the hot loop, -march=native letting it use whatever instruction extensions this exact chip (an Intel i9-12900HK) supports, -flto optimizing across the whole translation unit instead of one function at a time. The algorithm is byte-for-byte the same C source as the 9.68 number above.
| Stage | What changed | cycles/char | vs. Python |
|---|---|---|---|
| Python, loop-amortized | correct O(n) algorithm, dict lookup | 335.88 | 1× |
C, -O0 | array lookup instead of hash map; no compiler optimization | 9.68 | ~35× |
C, -O2 -march=native -flto | same source; compiler asked to optimize for this CPU | 2.71 | ~124× |
Three real numbers, three different causes, none of them a stopwatch.
One more check before trusting any of it. The -O2 build above is pinned to one CPU core with taskset -c 0. Run the same, already-compiled binary seven times without pinning it, and the numbers wobble: 3.63, 5.71, 4.98, 4.86, 4.83, 2.65, 4.88 cycles/character — the identical program, swinging by more than 2× from run to run.
The reason: this laptop’s chip has two kinds of cores, fast ones and power-saving ones, and a run this short can land on either between attempts. “Cycles per character” genuinely differs depending on which one it landed on — not noise around one true number, but two true numbers depending on where the OS put the process. Pin it to one core and rerun the same seven times, and the spread collapses to 2.70–2.79 — essentially flat. That’s the pinned number this piece reports throughout. The lesson travels past this one laptop: a hardware counter can still hand you a number that depends on which piece of hardware answered, so take more than one sample and control what you can before trusting the spread.
What the C rewrite costs, and who’s actually paying

Somebody fed this machine a lot of quarters to move a number that never left the cabinet. Photo by Teo Zac on Unsplash.
The strongest objection to all of this deserves stating at full strength, because it’s correct as far as it goes: almost none of this matters for a LeetCode problem. Big-O is most of the value on offer — the jump from O(n²) to O(n) dwarfs anything a compiler flag can do — and an engineer who spends an evening hand-tuning cache behavior on a problem that runs exactly once, to satisfy a badge nobody else will ever see, spent that evening on decoration, not engineering.
Chasing a badge that cannot even see your code is not optimization. It’s decoration wearing the costume of rigor.
That objection is aimed at the wrong target, though — this piece isn’t recommending the C pass for every problem. It’s separating two decisions that “make it fast” quietly bundles together, so an engineer can tell which one they’re actually making. The algorithmic decision — sliding window over brute force — pays off on a problem run once and a problem run a billion times a day. The hardware-tuning decision only pays off on the second kind, and paying it on the first kind is exactly the wasted evening the objection describes.
And the hardware-tuning decision has a real cost attached even when it is worth paying: -march=native means the binary benchmarked above will not run at all on a CPU that lacks whatever instruction extensions this exact i9-12900HK has — which is most CPUs that aren’t this exact i9-12900HK. Not “run slower.” It crashes on startup with SIGILL, the OS killing the process the instant it hits an instruction the chip doesn’t recognize. That flag is correct for measuring what this hardware can do locally, and it is the wrong flag for anything that ships to a fleet of machines you don’t control. Whoever inherits a production binary built with it pays for a decision made to win a local benchmark, not to serve a request from an unknown machine.
Where this stops being true
The 128-entry array is not a general string algorithm. It’s a bet that every byte fits in 0–127 — exactly LeetCode’s own stated constraint for this problem, and exactly the kind of assumption that breaks silently the moment the input isn’t guaranteed ASCII. A UTF-8 multi-byte character would overrun the array; the test suite here doesn’t cover that case, because it doesn’t need to for this problem.
And every number in this piece came from one physical machine, on powersave governor, sharing its 20 threads with whatever else happened to be running. A cloud VM’s virtual core, or a phone’s thermal-throttled ARM chip, would produce a different cycles-per-character number for the identical source — for reasons this piece never controlled for. The ratios (~35×, ~124×) are this machine’s ratios. The methodology — loop-amortize, read hardware counters instead of a clock, pin the core, take more than one sample — is the part meant to travel.
Close
None of this changes what to submit to LeetCode. The sliding window was already the right answer before a single cycle got counted, and the badge next to it will keep saying 0 ms for reasons that have nothing to do with whether that’s still true tomorrow.
What changes is smaller, and it’s not about LeetCode at all: the next time “make it faster” comes up on code that actually runs enough to matter, the badge on the screen is not the number to trust. Loop the hot path until a cold start stops dominating it. Read cycles and instructions off the hardware instead of a wall clock. Run it more than once before believing the number. That’s the whole method — the same four lines used above — and it works on a sliding window exactly as well as it works on whatever you’re actually being paid to speed up.
References
- LeetCode, Longest Substring Without Repeating Characters
- Brendan Gregg,
perfExamples — the reference this piece’s use ofperf stat’s hardware-counter mode follows - Intel, 12th Gen Intel Core Processors — Performance Hybrid Architecture — background on the fast/power-saving core split behind the unpinned-vs-pinned numbers