


A ScoreVector turns subjective taste into a structured, explainable representation
Five named axes — authenticity, projection, longevity, complexity, versatility — let a product compare, filter, and explain preference without hiding behind an opaque embedding.
- Axes chosen by a three-part admissibility test
- Cosine similarity over five explainable dimensions
- Prior art: the Fragrance Wheel and the 100-point wine score
- The honest tradeoff against a learned embedding
A product manager at Scentum asks a reasonable question: score how premium a fragrance feels. It sounds simple. Then an engineer tries to answer it, and finds two obvious options. Both fail for the same reason.
The first option is a set of checkboxes — floral, woody, fresh, warm, light. Checkboxes are easy to build and easy to explain. They rarely correlate with what a person who actually reviewed the fragrance said, because taste does not sort cleanly into a handful of categories.
The second option is a learned embedding: a single vector with hundreds of dimensions, trained so that similar fragrances land near each other. It captures far more nuance than five checkboxes ever could. But nobody, including the team that built it, can point to one of its numbers and say what that number means.
Both approaches ship. Neither one answers the question a customer actually asks. Not “how similar is this to other things.” Why this one.
That question is the real problem. Taste feels subjective, and it is tempting to treat “subjective” as a synonym for “unstructured” — something a model should learn on its own, without anyone explaining it.
It is not unstructured. It is undescribed.
Name a fragrance’s qualities. Give them a scale. Taste becomes something a product can compare, filter, and explain, the same way any other measured quantity can.
Here is the shape of the rest of this piece: what a ScoreVector is, how Scentum chose which axes belonged in it, how the numbers get produced from customer reviews instead of typed in by hand, what two older industries did with a version of this problem before software touched it, what a ScoreVector gives up next to a fully learned embedding, and where it still breaks.
What a ScoreVector is
Semantic Search as a Product already introduced dimensions as product vocabulary — subtle-or-projecting, crisp-or-creamy, familiar-or-unusual. Scales a person recognizes in their own request, and can use to correct a result. That article stopped at the product surface, at the words a person sees. This one goes one level down, to the representation those words are built from.
A ScoreVector is a fixed-length list of numbers. Every position is a named, human-readable axis, not an anonymous coordinate. That is what separates it from a learned embedding, which might also have five numbers, or five hundred, but where no position corresponds to a word anyone would recognize.
The engineering decision that matters is not which model produces the numbers. It is which coordinate system the product is allowed to reason in. A product can only compare, filter, or explain along axes it has already agreed to name.
Choosing which axes belong
Scentum settled on five axes: authenticity, projection, longevity, complexity, and versatility. Five was not a target to hit. Each axis had to pass the same test before it earned a place in the vector.
Can a stranger read the number back as one word, without training? Does moving it actually change what the product recommends or filters? Can someone label it from a sample of reviews, without a chemistry degree?
Fail any one, and it is not a dimension yet. It is a hunch that has not been checked.
- Authenticity — does it read as raw material, or as a clean synthetic accord.
- Projection — how far it radiates off skin, not how strong it smells up close.
- Longevity — hours before it fades to nothing on skin.
- Complexity — how many distinct facets a nose can separate before it reads as “one note.”
- Versatility — how many contexts, office, evening, humid climate, cold climate, it still works in.
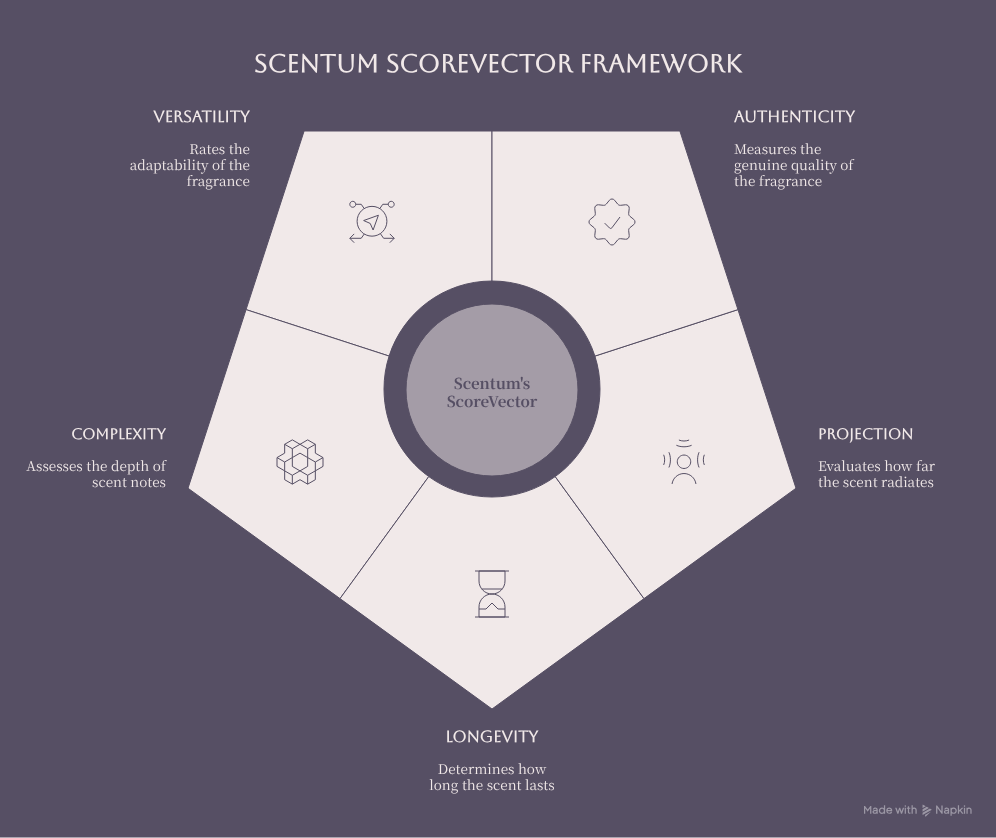
Five named axes, one vector — the same five shown throughout this piece.
The test also removes axes, not only adds them. “Sophistication” did not survive Scentum’s first pass. Across the review corpus, it moved almost exactly with authenticity — raise one, and the other rose with it. A duplicate axis wearing a new name gives the product nothing it did not already have. So it was dropped.
How the numbers are actually produced
None of the five numbers in a ScoreVector are typed in by a person. Scentum builds them from a sample of reviews scraped from retailer pages, fragrance forums, and review boards across the web. Not every review that exists — enough per fragrance that one enthusiastic or one bitter outlier cannot move the average by itself.
The reviews are the raw material. The five axes are what the pipeline reduces them to.
The reduction is a projection, not a classifier. It is the same technique sentiment analysis has used for years, run five times instead of once. A sentiment classifier represents “positive” and “negative” as a single direction in embedding space — found by embedding example sentences of each, then subtracting the average of one group from the average of the other. A review’s sentiment score is just the projection of its own embedding onto that direction.
Scentum does the same thing five times, once per axis. Take a handful of review sentences that clearly sit at the high end of an axis, and a handful that clearly sit at the low end. For authenticity, something like “smells like real oud, not a clean synthetic accord” against “reads like a candle, obviously synthetic.” Embed both groups. Subtract the mean of the low group from the mean of the high group.
That difference is the axis. Not a category — a direction, in the same embedding space the reviews already live in.

Pick the compass before you pick what to draw with it.
import numpy as np

def axis_direction(high_examples: list[str], low_examples: list[str], embed) -> np.ndarray:
    high = np.mean([embed(text) for text in high_examples], axis=0)
    low = np.mean([embed(text) for text in low_examples], axis=0)
    return high - low

def score_review(review_text: str, axes: dict[str, np.ndarray], embed) -> dict[str, float]:
    vector = embed(review_text)
    return {name: float(np.dot(vector, direction)) for name, direction in axes.items()}
Scoring one review is a matter of embedding it, then taking the dot product against all five directions at once. Scoring a fragrance is the average of that five-number result across every review the scrape returned for it.
The values below are exactly that average. Not a rubric someone filled in by hand:
from dataclasses import dataclass

@dataclass(frozen=True)
class ScoreVector:
    authenticity: float
    projection: float
    longevity: float
    complexity: float
    versatility: float

    def as_tuple(self) -> tuple[float, ...]:
        return (self.authenticity, self.projection, self.longevity,
                 self.complexity, self.versatility)

amber_oud_sample = ScoreVector(
    authenticity=8.0,
    projection=3.0,
    longevity=7.5,
    complexity=8.0,
    versatility=4.0,
)
The last number is worth pausing on. A 4 out of 10 on versatility tells a customer, before they buy anything, that this is not an everyday fragrance — heavy, intimate, low-projection, suited to one kind of evening rather than most of them.
A cosine similarity score from an anonymous embedding cannot say that. Nothing inside it was ever tied to the word “versatility.” A ScoreVector can, because versatility was a decision the team made about what the product should say — not a pattern an embedding happened to find on its own.
Comparing two fragrances then becomes ordinary geometry: distance, or more precisely cosine similarity, in a five-dimensional space instead of a five-hundred-dimensional one.
import math

def similarity(a: ScoreVector, b: ScoreVector) -> float:
    va, vb = a.as_tuple(), b.as_tuple()
    dot = sum(x * y for x, y in zip(va, vb))
    norm_a = math.sqrt(sum(x * x for x in va))
    norm_b = math.sqrt(sum(y * y for y in vb))
    return dot / (norm_a * norm_b)
The mathematics is identical to what a vector database does at a larger scale. What changes is smaller: every one of these five numbers can be shown in the product next to the word that produced it, because each dimension was chosen to correspond to something a person already says out loud.
What came before: the wheel and the hundred-point score
This is not a new problem. Two other industries solved a version of it long before software did. They solved it in opposite ways.
Curated Source

Fragrances of the World: Michael Edwards' Fragrance Wheel
Edwards built the wheel to organize preference, not to measure it. Fourteen families, arranged so that a taste in one predicts a taste in its neighbor. A ScoreVector borrows the same instinct for human-readable structure and points it at magnitude instead of family: not which neighborhood a fragrance lives in, but how much of each quality it has.
View source context"The Fragrance Wheel explains the relationship between innate fragrance preferences and the fragrance families."
It is a structured vocabulary, but a categorical one. A fragrance belongs to a family. It does not sit at a point on a continuous scale. The wheel answers what kind of thing something is. It was never built to answer how much of a quality it has — that is a different question, and it needs a different structure to hold the answer.
Wine scoring went the opposite way. It collapsed everything into a single number: the hundred-point scale popularized by Robert Parker.
A single governing number has real advantages. It fits on a shelf sticker. Any two wines can be ranked against each other without an argument about which axis matters more.
But the same collapse that makes it simple also makes it uninformative in conversation. A 92 says a wine is good. It does not say whether it is the tannic, structured 92 or the light, fruit-forward 92 — and that is precisely the distinction a person is likely to ask about next. A single number cannot carry two independent facts at once.
A ScoreVector sits between these two precedents on purpose. Continuous like the wine score, so two fragrances can be genuinely close or far apart, not merely sharing a family. Multi-dimensional like the wheel, so that closeness does not erase which quality made them close.
Collapsing taste to one number loses the information a recommendation needs to explain itself. Collapsing it into categories loses the information a comparison needs to rank. Five named, continuous axes keep both.
What a ScoreVector gives up
A fully learned embedding, given enough data, will very likely beat five hand-chosen axes on raw nearest-neighbor accuracy. This is not a reluctant concession. It is the expected result — an embedding is free to discover correlations between qualities nobody thought to name as an axis. A ScoreVector is limited to exactly the five it was given.
The embedding pays for that flexibility in two ways.
Nobody can read one of its five hundred positions and say what it means. The product cannot turn a learned dimension into copy like “less sweet” in a refinement control, because that dimension was never attached to a word a person actually said.
And a fully learned embedding needs a large set of labeled pairwise comparisons before it is any good — people saying these two are alike, these two are not, at a scale Scentum does not have on its first day. A ScoreVector asks for something much smaller: a handful of exemplar sentences per axis, and the reviews already sitting on the web, waiting to be read.
The choice, then, is not which representation is more accurate in the abstract. It is which one the product can afford to explain, and afford to build, on the day it needs to ship. Scentum chose explainability and an immediate start over a small amount of retrieval accuracy it currently has no way to earn.
Where the method is weak
None of this makes a ScoreVector correct by construction. The ways it is not are worth stating plainly.
The five axes correlate more than the admissibility test admits. Authenticity and complexity move together often enough in the review corpus that the space carries less independent information than five separate numbers implies.
People curating the exemplar sentences disagree with each other more on projection than on longevity — projection is harder to judge from a written review than a quality experienced over a week of wear.
Cultural variance goes entirely unaddressed. A review that reads as “clean” in one market may read as “sterile” in another, and a single global ScoreVector currently cannot tell the difference.
And because the axes are fixed at five, they will always miss some real quality a fragrance has that nobody thought to name as a sixth. That is exactly the information a learned embedding would have kept, and a ScoreVector, by construction, cannot.
None of these limits is a reason to abandon the vector. It is a reason to keep a learned embedding nearby as a second signal — one that only has to account for whatever the five named axes miss, instead of asking five numbers to do the work of five hundred.
Applying the same test elsewhere
The same three questions that chose Scentum’s five axes apply to any product that needs to turn a subjective quality into a number. Can a stranger read it back as one word? Does moving it actually change what the product does? Can someone identify it from real examples, without specialized training?
An axis that fails any of these is not ready yet, whatever it happens to be called.
A ScoreVector is not a personality test, and it is not a scientific instrument for measuring taste. It is a design decision. It stays useful for exactly as long as its axes correspond to words people actually say — the same discipline behind choosing a purpose function for any other system: decide what the product is allowed to reason about, and say plainly what that choice leaves out.
References
- Michael Edwards, “Explore Michael Edwards’ Fragrance Wheel,” Fragrances of the World: fragrancesoftheworld.com/FragranceWheel — the source quoted in the Curated Source box above; origin of the Fragrance Wheel classification, first introduced in 1983.
- Robert M. Parker Jr., Parker’s Wine Buyer’s Guide, Simon & Schuster — the origin of the 100-point wine scoring scale referenced in this piece.
- Gerard Salton, A. Wong, and C. S. Yang, “A Vector Space Model for Automatic Indexing,” Communications of the ACM, 1975. The academic origin of comparing items by cosine similarity in a named coordinate space — the same math behind the
similarity()function above. - Kelly Sikkema, “amber glass bottles,” Unsplash image
E3HAXh7o0hI: Unsplash photo. - Andy Brown, “a circle of different colors on a table,” Unsplash image
_jILcijLh_M: Unsplash photo. - Matt Artz, “two gray graphing compasses,” Unsplash image
mn9urGl7vIA: Unsplash photo.